# Using the AI Analyst
Athenic enables you to explore data, ask questions, and track key metrics. It leverages the **Knowledge Graph** to organize your datasets, joins, and business logic, allowing for accurate interpretation of natural language queries.
If you haven’t yet, [create an AI Analyst](https://docs.athenic.com/getting-started/new-project-and-project-settings) from the **Home** page by clicking **"New AI Analyst."**
Once your AI Analyst is set up, you can start asking questions in plain English. Athenic translates these into SQL, generates results, and displays interactive charts.
AI Analyst view
### Suggested Questions
**Suggested Questions** use your Knowledge Graph to surface relevant prompts based on your KPIs, dimensions, and business terms.
They help teams uncover insights they might not have thought to ask by suggesting follow-up questions tied to your datasets and recent activity, making it easier to explore your data in depth.
Learn more: [Suggested Questions](https://docs.athenic.com/getting-insights/using-projects/suggested-questions)
### Add to Dashboard
After generating a chart, click **“Add to Dashboard”** to save, customize, and track it over time. This enables teams to monitor key metrics using up-to-date results powered by the underlying Knowledge Graph structure.
AI Chat Page
Chart Customization
### Modify Charts with AI
Use **Modify Chart with AI** to quickly adjust visualizations. This feature understands your instructions in context, leveraging the Knowledge Graph to ensure changes to metrics, filters, or display formats are accurate.
Learn more:
* [Modifying a Chart](https://docs.athenic.com/getting-insights/using-projects/modifying-a-chart)
* [Chart Basics](https://docs.athenic.com/getting-insights/using-projects/modifying-a-chart/chart-basics)
* [Advanced Visualizations](https://docs.athenic.com/getting-insights/using-projects/modifying-a-chart/advance-visualization-capabilities)
Dashboard Page
### Customize Your Dashboard Layout
After adding charts, click **“Edit Layout”** to rearrange tiles, resize visualizations, and group related metrics for storytelling or reporting.
Learn more: [Editing a Dashboard](https://docs.athenic.com/getting-insights/using-projects/using-the-dashboard/editing-a-dashboard)
### Work with Datasets
Datasets are the foundation of your Knowledge Graph. You can create them with or without SQL, then annotate, join, or map terms to build business context.
Learn more: [Creating Datasets and Data Preparation](https://docs.athenic.com/getting-started/creating-datasets-and-data-preparation)
Home Page
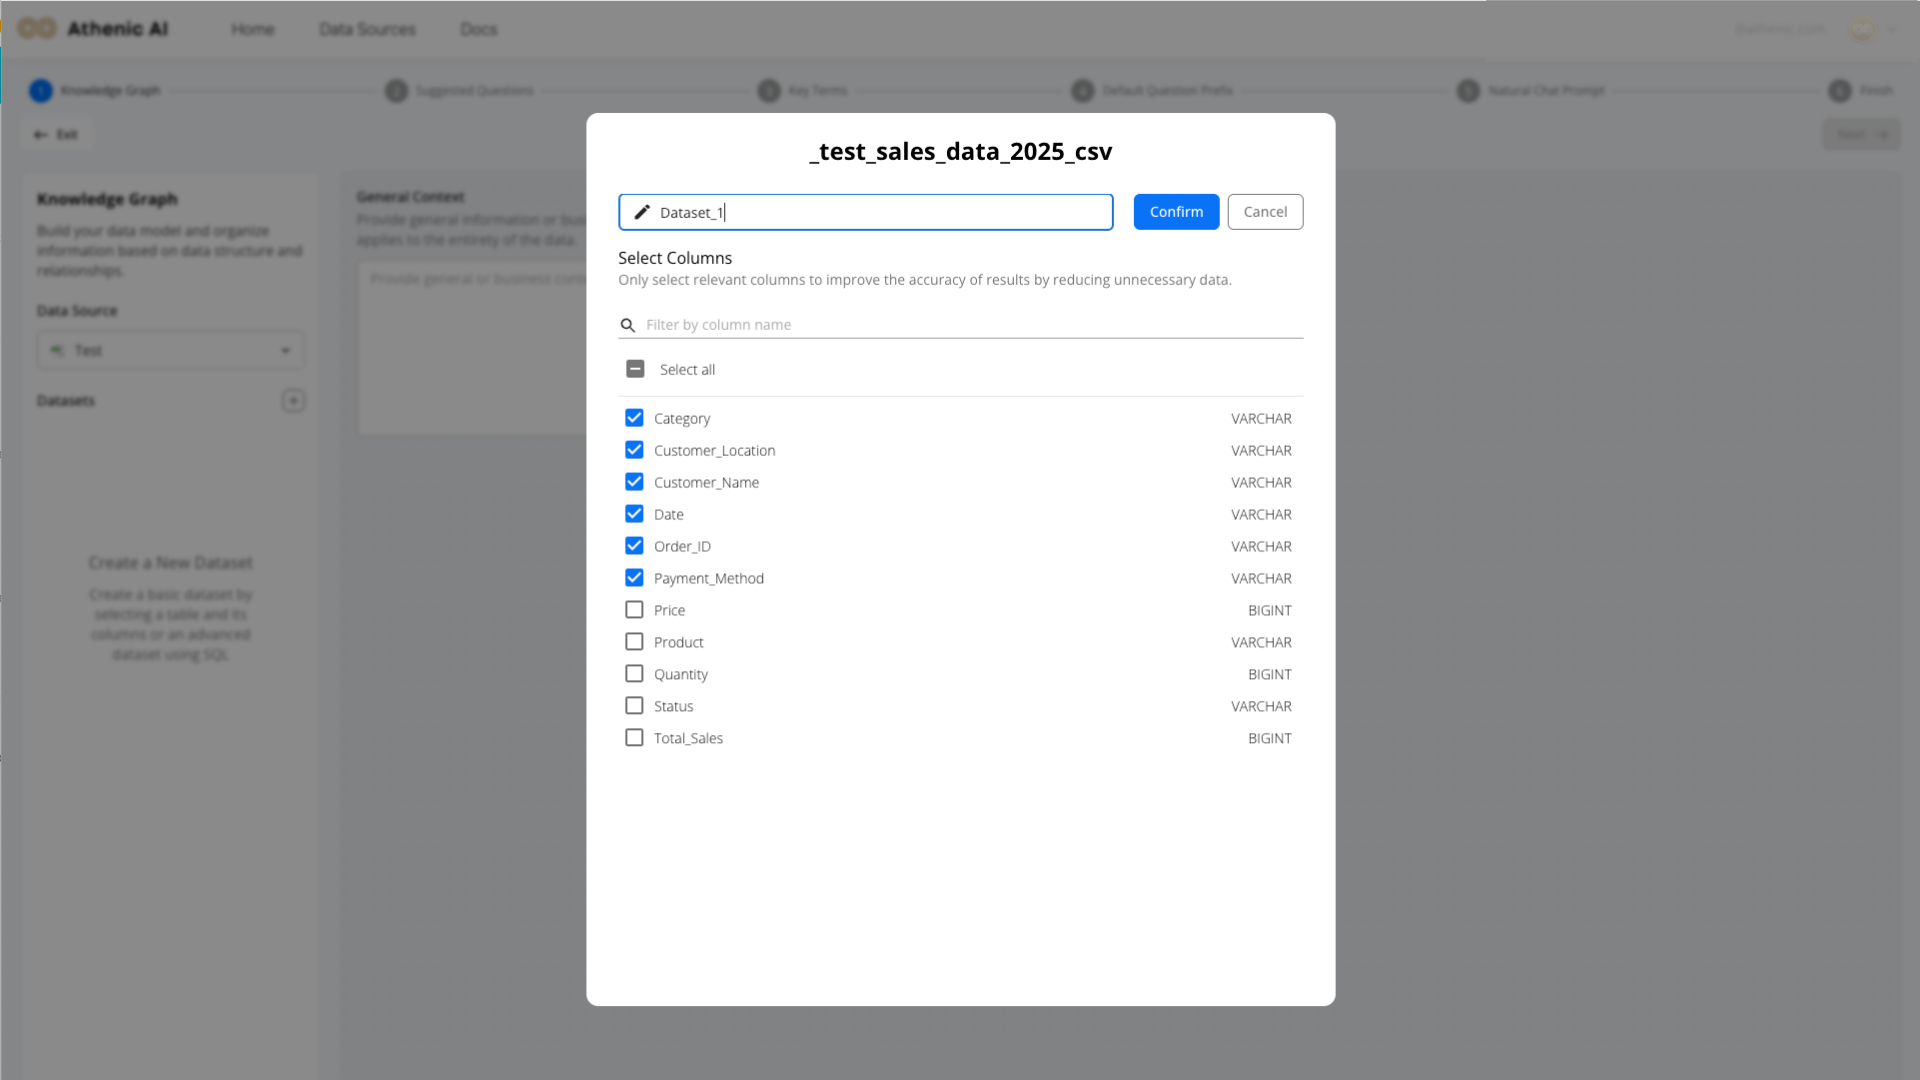
Select Columns
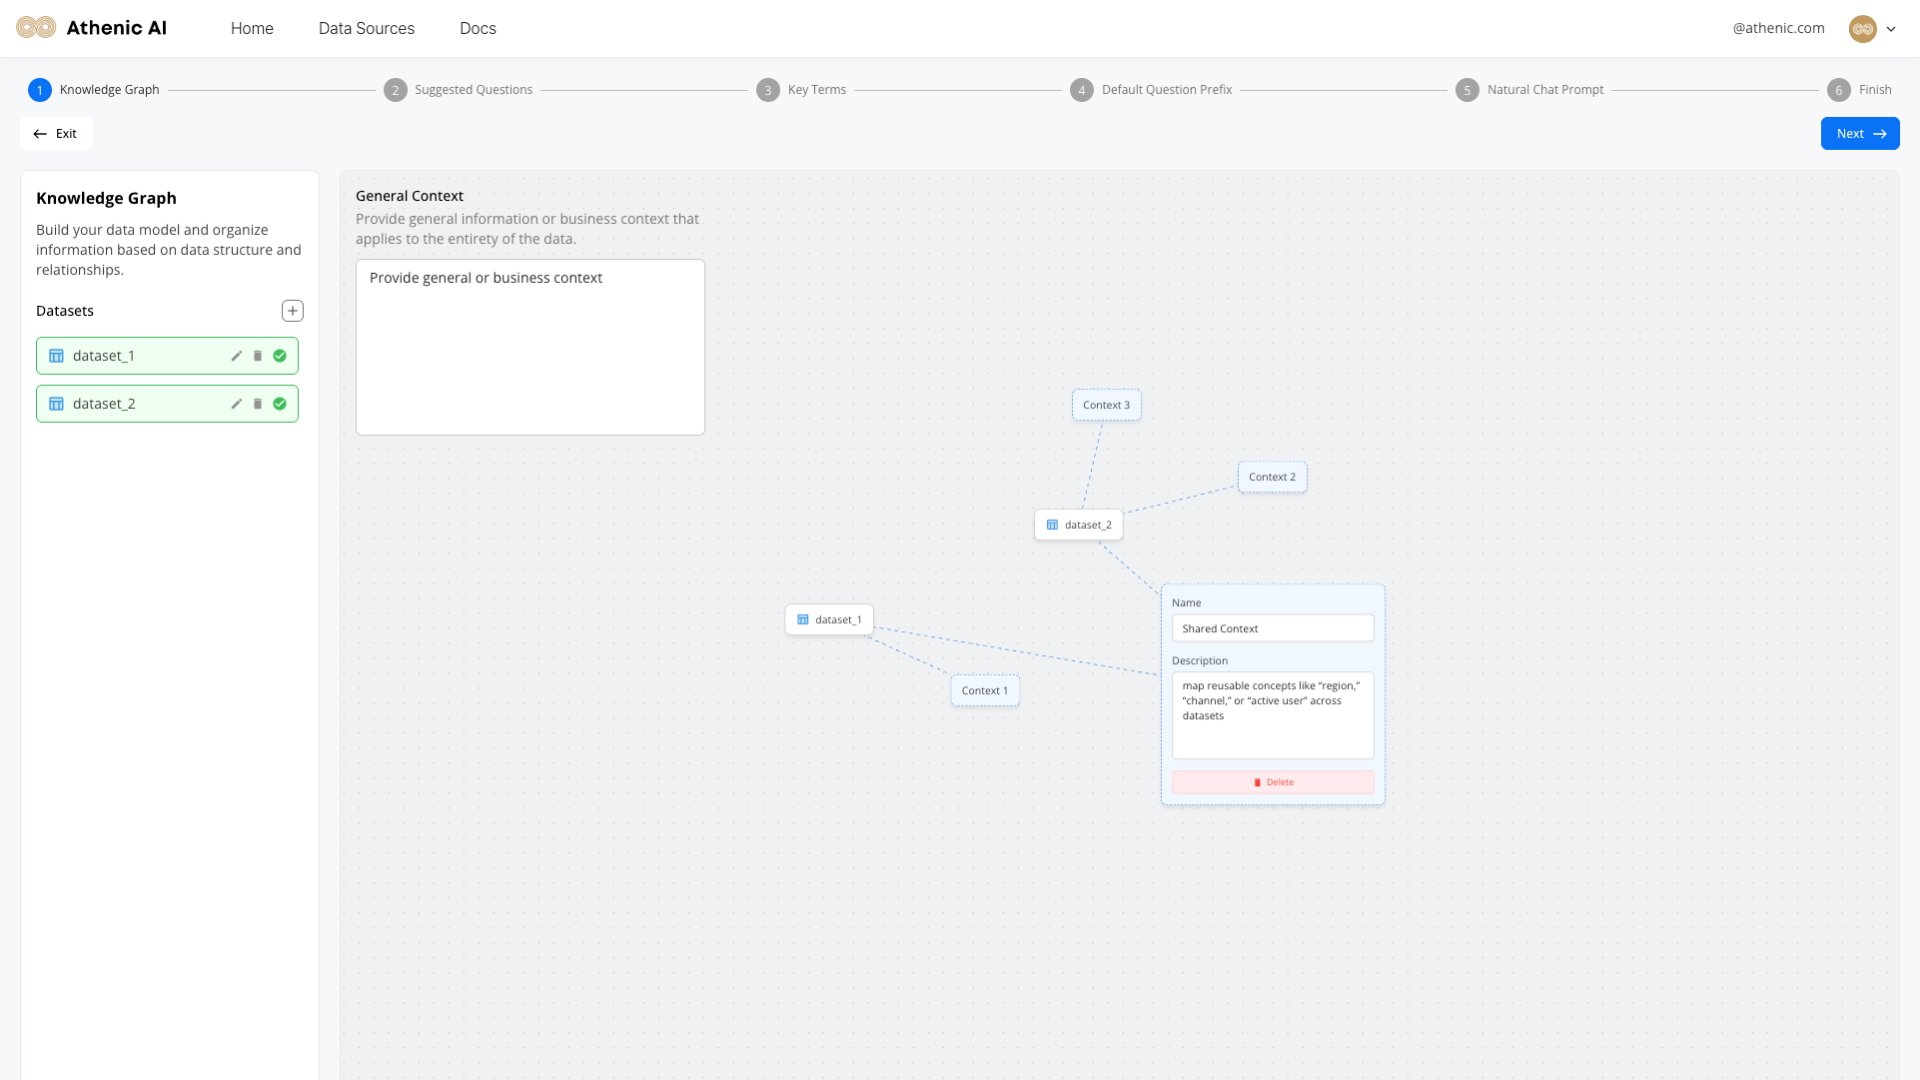
### Configure the Knowledge Graph
Use the Knowledge Graph to teach Athenic how to interpret your data by:
* Defining joins between datasets
* Adding descriptive field details
* Mapping KPIs and business terminology
Learn more: Knowledge Graph Overview
### Edit Data Configurations
Refine your AI Analyst’s scope and improve performance by configuring your datasets—this means selecting tables and fields, adjusting data types, and managing joins.
Actions include:
* Removing unnecessary fields
* Adjusting data types
* Adding or joining more tables
To edit your datasets and data source configurations, go to the **AI Analysts** page, click the **three dots** menu next to your AI Analyst, and select **“AI Setup.”**
Learn more: [Creating Datasets and Data Preparation](https://docs.athenic.com/getting-started/configure-data-source-and-data-preparation)
History
### Use the History Tab
The **History** tab captures every question asked by your team. Team admins can:
* Review past queries along with the generated SQL and results
* Identify user-flagged results easily
This view supports oversight and ongoing analysis of key topics across your team.